Barclay Y-DNA Project at Family Tree DNA
The seventeenth century is generally recognised as a period of great uncertainty for genealogical research. Surviving records of the general population at the time are few and those that do remain often lack the detail of later records. Given this, it is hardly surprising assumptions based on a combination of names, dates, locations, and associations, are frequently employed in an attempt to connect one’s ancestors with a better recorded family of the same surname. Often, the logic of such assumptions is indisputable. However, as numerous examples can testify, even the most logical assumption can be entirely incorrect.
The Barclay family occupies a somewhat unique position in genealogical terms. As members of the lower nobility, records of individuals from various branches are found frequently throughout Scotland in the pre- and post-sixteenth century eras. Their arrival in England in 1066 from Normandy is well recorded, as is their migration to Scotland in the twelfth and thirteenth centuries, all of which has been confirmed by DNA analysis. However, one result of such an ancient origin is the production of many cadet lineages, frequently confounding attempts by genealogists to distinguish between them. Often these are the same problems faced by the family historians of the nineteenth and twentieth centuries that produced what are now well-recognised as erroneous accounts.
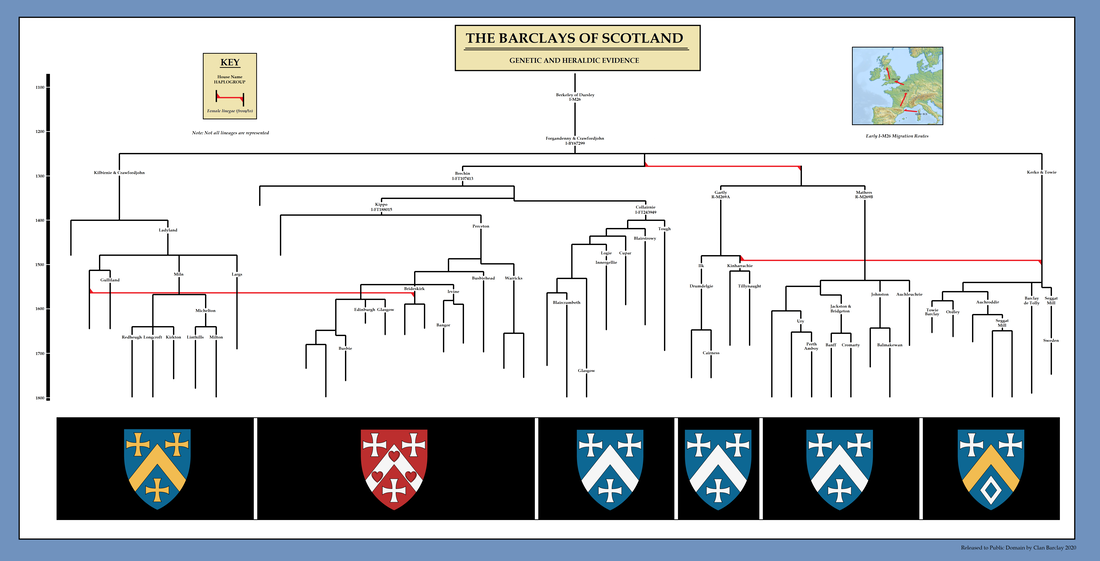
Modern genealogists need modern tools if they are to overcome the problems outlined above. To this end, Clan Barclay encourages members to avail themselves of Y-DNA testing at Family Tree DNA, to join the Barclay Surname Project at FTDNA, and to compare their results to those of other members at the FTDNA Clan Barclay International DNA Database. Clan administrators with the assistance of individual members have developed this database to a point where descendants of each of the major Barclay houses of Kilbirnie-Ladyland, Perceton, Collairnie, Touch, Gartly, Mathers-Ury and Towie, may now be distinguished from one another with certainty. Even the most basic of Y-DNA testing allows for members to be accurately placed into one of two larger groups (i.e. the Barclays of Gartly and Mathers-Ury in one group and the Barclays from other houses in another), though testing at a 67 or 111 marker level is required to distinguish between the houses within each group.
The age of myths in the history of the Barclays is now finished. An outline of the relationships between the various Barclay houses as determined by current research is included below. Each member who contributes to the Clan’s Y-DNA database provides information by which these relationships may be further defined, and in return receives vital information about their own origins. Members who are yet to undergo Y-DNA testing are strongly encouraged to do so and to take their rightful place in the Clan.
Our goals at the Barclay Surname Project include the following:
To that end, we invite Barclay men join the Clan Barclay International Y-DNA Project and to share your identified ancestry. Participation from confirmed and probable descendants of each of the Barclay houses of Kilbirnie-Ladyland, Collairnie-Perceton, Mathers-Ury, Towie-Barclay, and the Russian Barclays de Tollie is especially sought by the Project for the certainty they provide. No matter the confidence of lineage, however, all Barclay men are welcomed and encouraged to participate in the Project to gain further understanding of the history of the clan in general and of members specifically. Assistance in determining genealogical lineages is provided by the Project to members at no cost.
How to participate:
DNA can be confusing. For further information, see these links:
If there is any further information or assistance you require in this matter, please contact Clan Barclay International.
- Utilize Y-DNA results of confirmed descendants of various houses and documentary evidence to establish an historic structure of the evolution of the houses of Clan Barclay.
- Add Y-DNA results of probable descendants of various houses in combination with examination of documentary evidence to enhance historic understanding and to inform the overall structure of the evolution of the houses of Clan Barclay.
- Use Y-DNA results to place ungrouped people and people unsure of their ancestry as descendants of various houses and apply documentary evidence to assist in the understanding of their personal family trees.
- Employ autosomal and mitochondrial DNA results to supplement findings.
- Discover haplogroups and ancient migration patterns of our participants.
To that end, we invite Barclay men join the Clan Barclay International Y-DNA Project and to share your identified ancestry. Participation from confirmed and probable descendants of each of the Barclay houses of Kilbirnie-Ladyland, Collairnie-Perceton, Mathers-Ury, Towie-Barclay, and the Russian Barclays de Tollie is especially sought by the Project for the certainty they provide. No matter the confidence of lineage, however, all Barclay men are welcomed and encouraged to participate in the Project to gain further understanding of the history of the clan in general and of members specifically. Assistance in determining genealogical lineages is provided by the Project to members at no cost.
How to participate:
- Go to Family Tree DNA and order your Y-DNA kit. It is encouraged that men in the Project test 111 markers.
- A testing kit will be mailed to you. When you receive the kit, follow the enclosed directions, swabbing the inside of your cheek and returning the kit to Family Tree DNA with the envelope provided. Each participant in the Y-DNA Project is identified only by the kit number associated with the test to maintain privacy.
- When you establish your account at Family Tree DNA, join the Clan Barclay International Y-DNA Project. When you establish your account, the Barclay Project likely will be recommended to you, and you only need to click to join. If the Project is not recommended upon registration, go to the top of your dashboard, click on “myPROJECTS,” click on “Join a Project,” and search for Barclay.
- When your results are processed, you will be notified with your genetic matches and haplogroup via email. Assistance in interpreting results is provided by the Project at no cost.
DNA can be confusing. For further information, see these links:
If there is any further information or assistance you require in this matter, please contact Clan Barclay International.
Understanding Y-DNA Results
By Tim Barclay, Barclay Historian
What is DNA testing?
DNA testing is conducted on “marker” sections of DNA known as short tandem repeats (STRs) and single nucleotide polymorphisms (SNPs).
DNA testing can be conducted on both sex (Y and X) and somatic chromosomes. Y-DNA testing produces results that can be used to reconstruct an ancestral male lineage; X-DNA testing produces results relevant to maternal lineages.
Haplogroup Results
For Y-DNA test participants in the Clan Barclay International DNA Project, their results may be viewed at the Clan Barclay International DNA Project Y-DNA Colorized Chart. These results include the haplogroup to which the individual belongs. Haplogroups are ancient lineages thousands and tens of thousands of years old. Participants in different haplogroups are functionally not related to one another in the male line. Most Barclays belong to the I-P37 or R-M269 haplogroups and their subgroups.
Genetic Distance
Participants are provided with the names and contact information of other participants whose results match their own at various STRs and SNPs. The number of differences in results are referred to as “genetic distance”. Genetic distance is a function of both the number of generations between participants and their most recent or last common ancestor (LCA) and the number of STRs and SNPs that are tested – the more sections of DNA that are tested, the greater the genetic distance we would expect to find.
Genetic Analysis
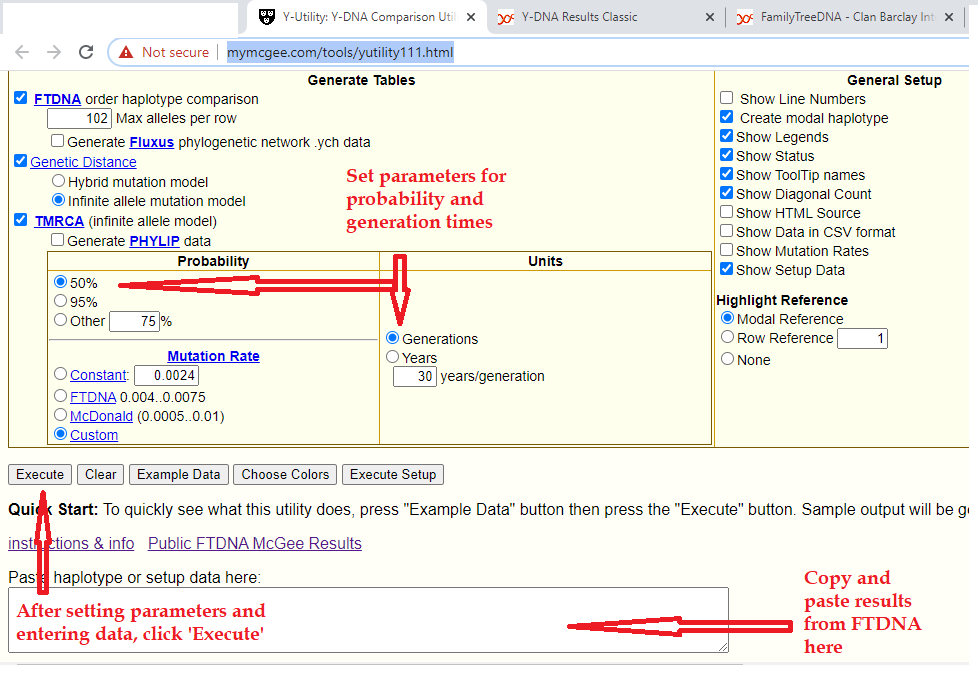
Numerous programs and websites offer a variety of calculations that may be used to analyse DNA results. Most are quite easy to use – the simplest merely require participants to enter the results under study and are provided with an analysis of genetic distances and estimate of time or generations between them and their LCA.
An example of this using the My McGee Y-DNA Comparison Utility is provided below:
Interpreting Results
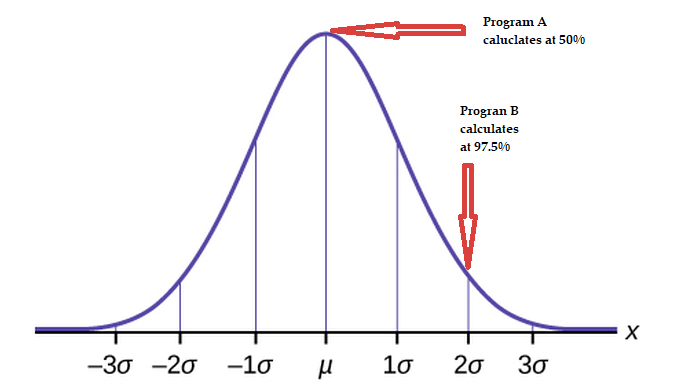
The estimate provided by a genetic analysis is usually expressed in the form of a certain probability a participant’s LCA is within a certain number of generations. As different programs use different levels of certainty, this can be a source of some confusion. Whichever program is used, it is important to keep in mind these probabilities follow a bell curve or normal distribution. This means, for example, while one program may express a 50% probability of an LCA being within x generations and another uses a 97.5% probability of an LCA being within (x + y) generations, they are essentially the same result, as shown below:
The estimate provided by a genetic analysis is usually expressed in the form of a certain probability a participant’s LCA is within a certain number of generations. As different programs use different levels of certainty, this can be a source of some confusion. Whichever program is used, it is important to keep in mind these probabilities follow a bell curve or normal distribution. This means, for example, while one program may express a 50% probability of an LCA being within x generations and another uses a 97.5% probability of an LCA being within (x + y) generations, they are essentially the same result, as shown below:
Reliability of Results
The calculations used in most genetic programs to determine the number of generations to an LCA have improved considerably in the last decade and are now generally regarded as accurate (within a certain degree). Effectively, this means that in most cases expressing results based on a very high level of probability is not only unnecessary but counterproductive. Instead, it is generally far more instructive to consider the results given at a 50% probability and then to allow up to a 30% variation from there. In other words, if there is a 50% probability that an LCA lived within 20 generations, users should consider the range 18-22 generations as very likely, 16-24 generation as almost certain and 14-26 generations as ascertain. By combining different users results and increasing the number of markers being tested, these ranges may be further narrowed.
Examples
Two simple examples produced using the My McGee Y-DNA Comparison Utility will serve to illustrate the above details.
Example One:
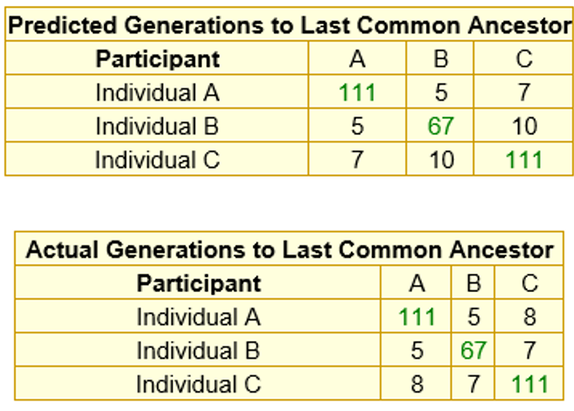
The first example is a comparison of DNA results of closely related individuals with a well-documented shared ancestry, which allows us to compare the predictions of this genetic program with reality. The number of markers tested is given in green text and results in black. Note the increasing accuracy of the predictions with an increasing number of markers being tested.
Example Two:
The second is a comparison of more distant related Barclays representing the lines of Perceton and Towie who are separated by 24 generations.
The second is a comparison of more distant related Barclays representing the lines of Perceton and Towie who are separated by 24 generations.
As can be seen, even simple comparisons using 67 markers yield results accurate to within 30% of reality. At 111 markers, the level of accuracy approaches 100%.
Conclusion
DNA testing provides a unique opportunity to assist in determining an individual’s ancestry. The power of DNA testing is increased with an increasing number of participants and an increasing number of markers being tested. Some degree of interpretation is required when analysing these results, but with careful comparison against other records it is possible to achieve very high degrees of certainty for the same.
CLAN BARCLAY INTERNATIONAL
Copyright © 2021


